Debugging Stories: A Strange Latency
Contents
The problem was described as “responses from SAP are slow.”
The Setup
A client had wanted to automate a manufacturing process. The manufacturing steps had previously all been performed in SAPGUI: MRP-produced planned orders were converted to production orders that show up in the custom transaction which had had been created for the manufacturing execution. As the order was executed on the shop floor, various details about the order and the produced units were recorded in the transaction and upon completion, production order confirmations were posted.
In order to move all this to the automated cell, web services had to be created so that the cell could get the required data from SAP (basically the work queue and details for individual production orders) and so that it could send details about the manufacturing execution to SAP (production order confirmations and so forth).
After some initial hiccups, this integration had been running for a year or so before it was discovered that the way that the automation cell had been implemented made it expensive to add new types of products. This led the client to re-implement the automation cell using a new automation supplier, with the main focus on addressing the cost and difficulty of adding new products.
The changes were made to the automation cell, while the SAP side of the integration remained as-is. So I was skeptical when I first heard that “it takes upwards of a minute for SAP to respond.” After all, the integration had already worked for while and I had never heard complaints about such extreme latencies.
The Investigation
While exclaiming “it wasn’t slow with the previous implementation, you must have screwed up!” might’ve gotten us off the hook, it would not have solved the issue that the client was experiencing; it was better to help with the investigation.
The first place to check whether SAP really was that slow in serving the web service calls was the SRT_UTIL transaction. Activating a trace for a user allows one to see details like processing duration and request payloads:
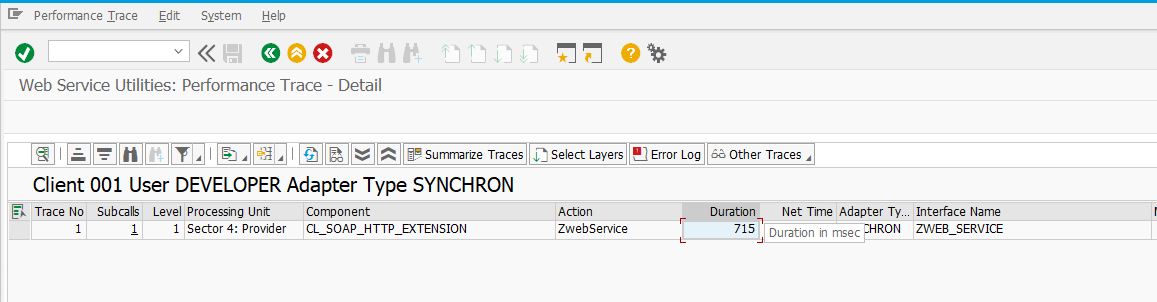
Call duration in transaction SRT_UTIL
SRT_UTIL revealed that the web services were rarely taking more than a second to execute and never more than a minute. So if the issue was not in SAP, it had to be somewhere between the automation cell and SAP, right?
The challenge with investigating this hypothesis was that because the machine communicating with SAP was a programmable logic controller (PLC), i.e. an extremely limited computer system, we could not just login remotely and try to connect to SAP with SoapUI or a browser to see if we could observe the slow responses that way. The automation supplier was left to investigate the issue from the PLC side, but there was no immediate solution.
The Cause
I had implemented an HTTP client in the past. In my implementation, I parsed the HTTP response a byte at a time as it came through, in part so that I would know how many bytes to expect to receive (based on the Content-Length header field):
|
|
Handling the response this way is somewhat tricky, as you cannot expect any part of the response to have been received completely. In the absolute worst case, you could receive a byte at a time and would then have to combine those to see if they form a valid response.
If you wanted to make the implementation simpler (and you were using HTTP 1.0), you could just buffer the received bytes until the connection is closed and then proceed to parse the response:
|
|
For some reason, it occurred to me that HTTP in the PLC might be implemented in this manner and that the latency we were witnessing could thus be the delay before SAP closes an idle HTTP connection.
I implemented a small program to test this and observed that it took roughly a minute from receiving the last byte of the response until SAP closed the connection. Adding a Connection: close header field to the request reduced this delay to a few milliseconds.
It turned out that programmers from the automation supplier had assumed that the Connection: close header field was already included in the HTTP requests. However, the header field was missing for some reason and causing the idle timeout to appear as additional latency in the web service calls. Adding the header field resolved the issue.
My sudden spark of inspiration was not the only we could have arrived at the same observation: header fields are also visible in SRT_UTIL:
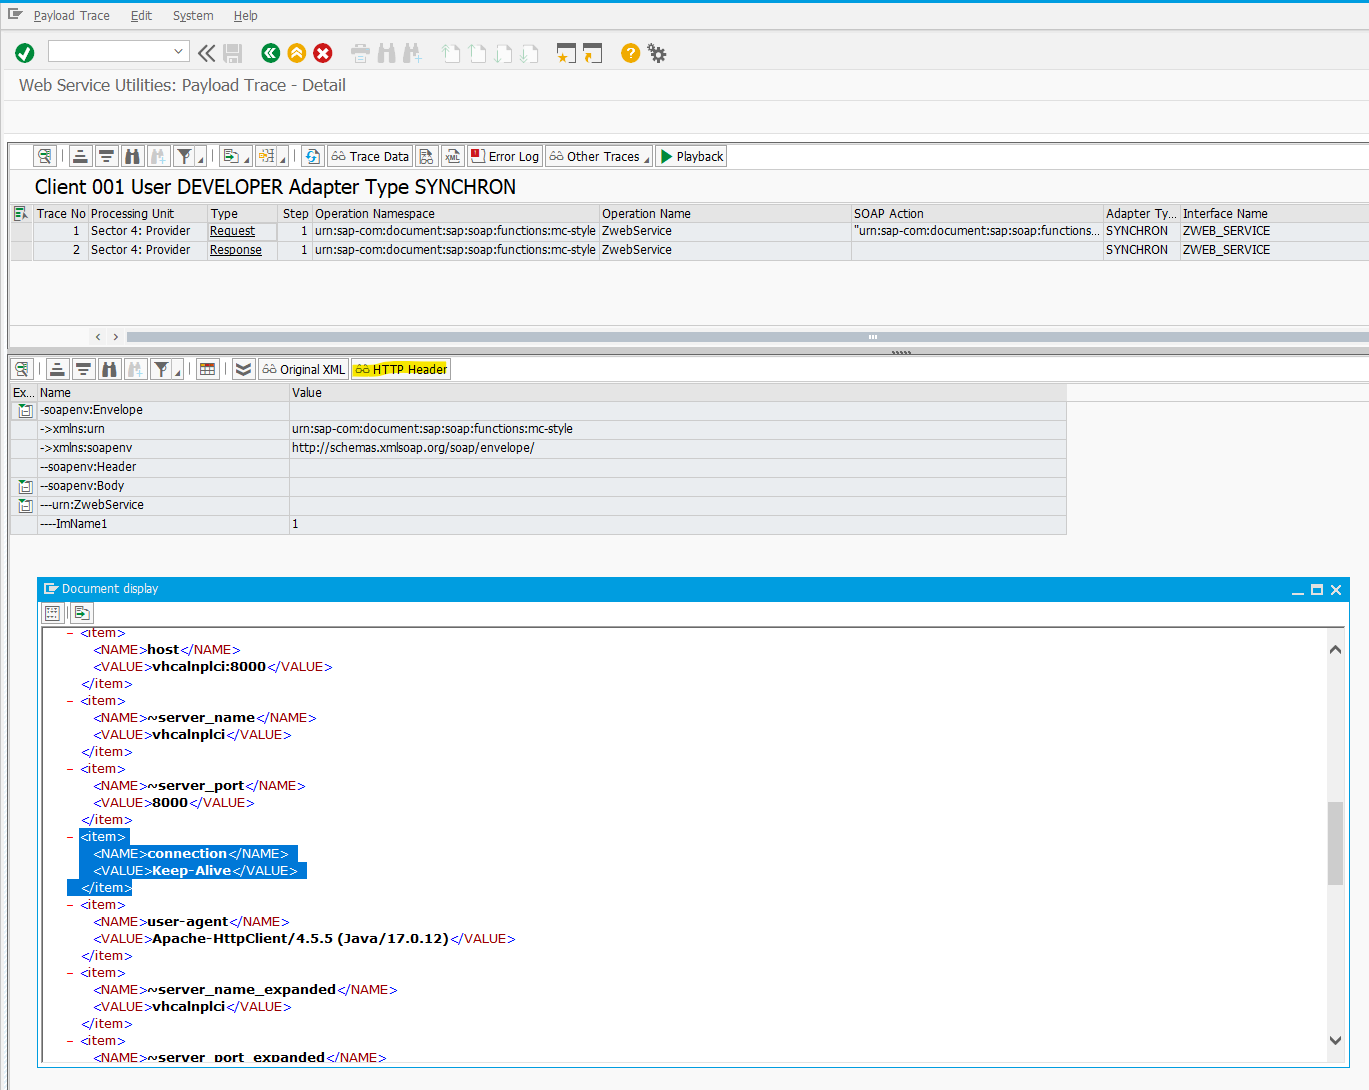
Header fields in transaction SRT_UTIL
Nevertheless, sometimes it helps to have a deeper than surface-level familiarity with the involved communication protocols.